Release 1.2.1
We've pleased to announce the release of VisuallyJs 1.2.1, containing several useful new features and a couple of great starter apps.
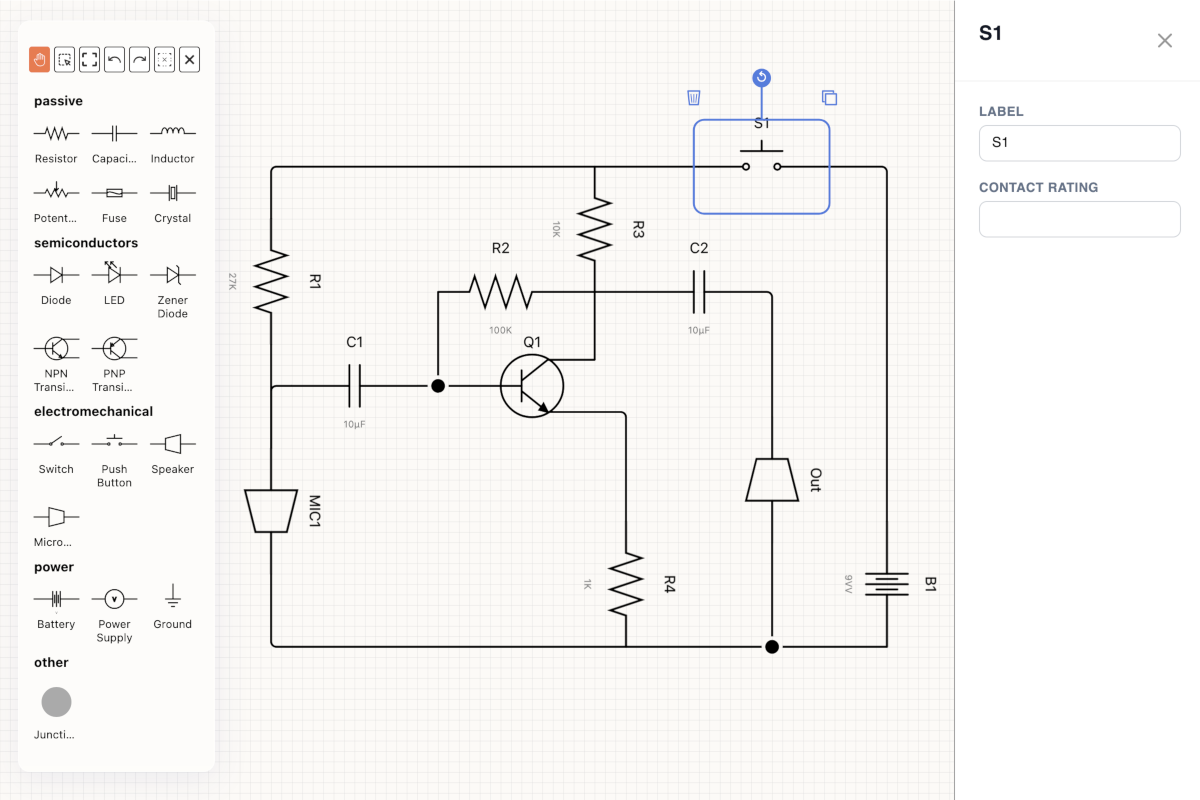
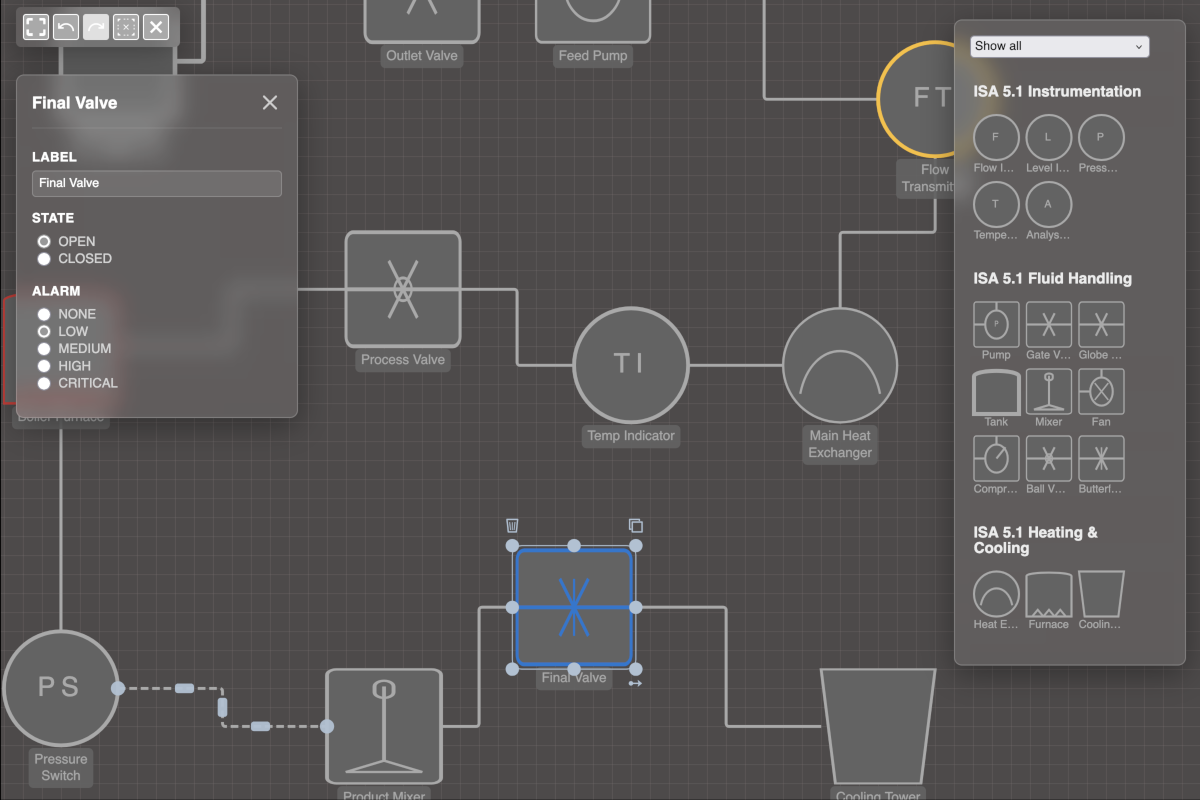
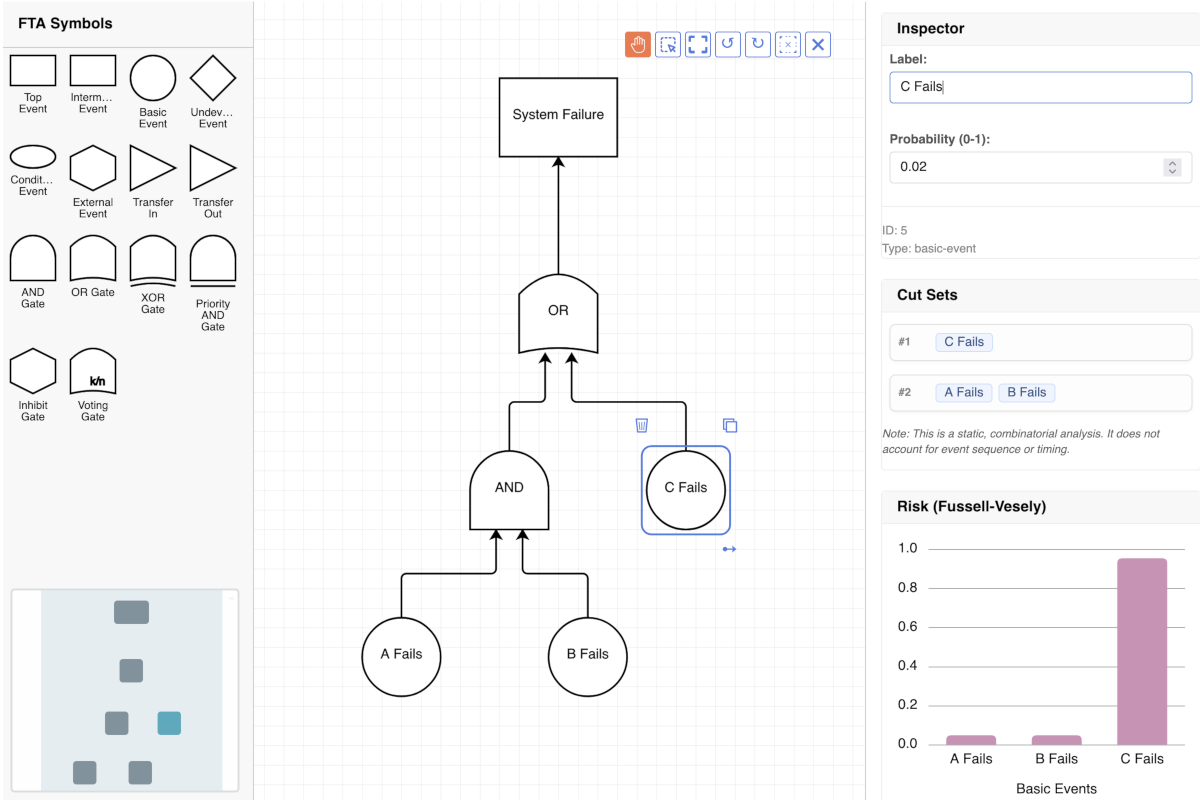
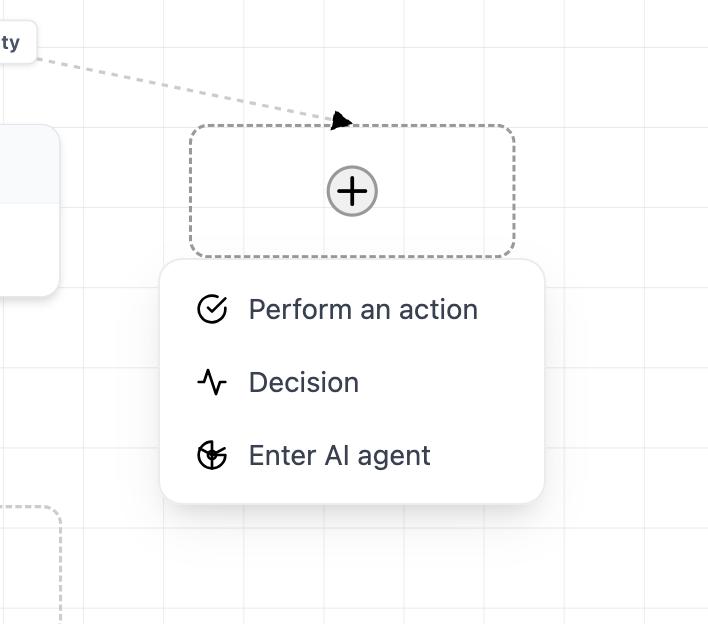
- Popups - components that VisuallyJs automatically keeps aligned with some vertex in your canvas, adjusting for pan/zoom as necessary
- A brand AI Agent Builder starter app was added
- Component overlays for Vue and Svelte - use components as overlays, fully wired into the reactive state and the VisuallyJs data model
- Support for marking up properties inside inspectors as belonging to ports on a vertex, allowing you to edit ports in your data model alongside the nodes they belong to
- Several new signals were added to the BaseVertexComponent in Angular, providing reactive state that exposes the edges attached to the vertex.
- We added a new renderer - the Paper component. This is a "static" version of the Surface: nodes, groups and edges are all rendered in the same way, but the view does not support pan or zoom, and the canvas is scaled automatically so that the content is always visible in the viewport.
- We dusted off the FIFA World Cup visualization from 2018 and released it as a starter app for VisuallyJs.
Popups
AI Agent Builder

Everyone's got one of these, and now we do too! But we're pleased to be able to report that this app required far fewer lines of code than similar demonstrations from other libraries (almost 1/5th of the size of the codebase from another well-known diagramming library!). Our AI Agent Builder is fully featured and ready for you to drop in to your app, or use as a base for your own. Check it out here - a link to the repository is on the demo page.
Component overlays
Support for using components as overlays has been in our Angular and React integrations for some time now. In 1.2.1 we've also added this feature to our Vue and Svelte integrations.
Port Inspectors
Inspectors provide a convenient means of wiring up property editors to the vertices in your app. Prior to 1.2.1, though, if you wanted to edit the properties of ports on your vertices, you'd have to setup a separate rendering condition for them. In 1.2.1 we've added support for a new vjs-port attribute, which allows you to tell VisuallyJs that some input field in your inspector pertains to a port, not the vertex:
<div>
  <input vjs-att="label"/>
  <input vjs-port="yes" vjs-att="label"/>
  <input vjs-port="no" vjs-att="label"/>
</div>
Here, our inspector allows us to edit the 'label' property on the vertex itself, as well as each of the vertex's ports.
Angular Signals
With every release we're modernising and tightening up our Angular integration, and 1.2.1 is no exception - we've added several signals to the BaseVertexComponent, allowing you to reactively access the edges attached to a given vertex. This makes it easy to do things like showing an 'add child' button if the node has no children, for example:
@Component({
  template:`<div>
  <h1>{{$data().label}}</h1>
  @if(sourceEdges().length === 0) {
    <button (click)="addChild">Add Child</button>
  }`
})

export class MyComponent extends BaseNodeComponent {}
You can get the list of source/target edges connected to just the vertex itself, or all of the source/target edges connected to the vertex and any of its ports.
We've also updated the SurfaceComponent, PaperComponent and DiagramComponent to convert the data and url inputs into signals. You can still use them as plain old inputs, but now you can wire them up to signals and have the component reload dynamically.
Paper Component
Sometimes you want to render a static view of your dataset, without given users the ability to pan, zoom or drag elements around - but you still want them to be able to interact with, and update, the model. The Paper component gives you that. It's a version of the Surface without pan, zoom or element dragging, and it automatically scales its canvas to fit inside the bounds of the viewport (unless you don't want it to; you can switch off scaling and have it fill its natural size, and the parent will scroll if needs be).
We're using this component in the Group Stage and Journey View components of our FIFA World Cup visualizer - we look forward to seeing what you build with it!
FIFA World Cup
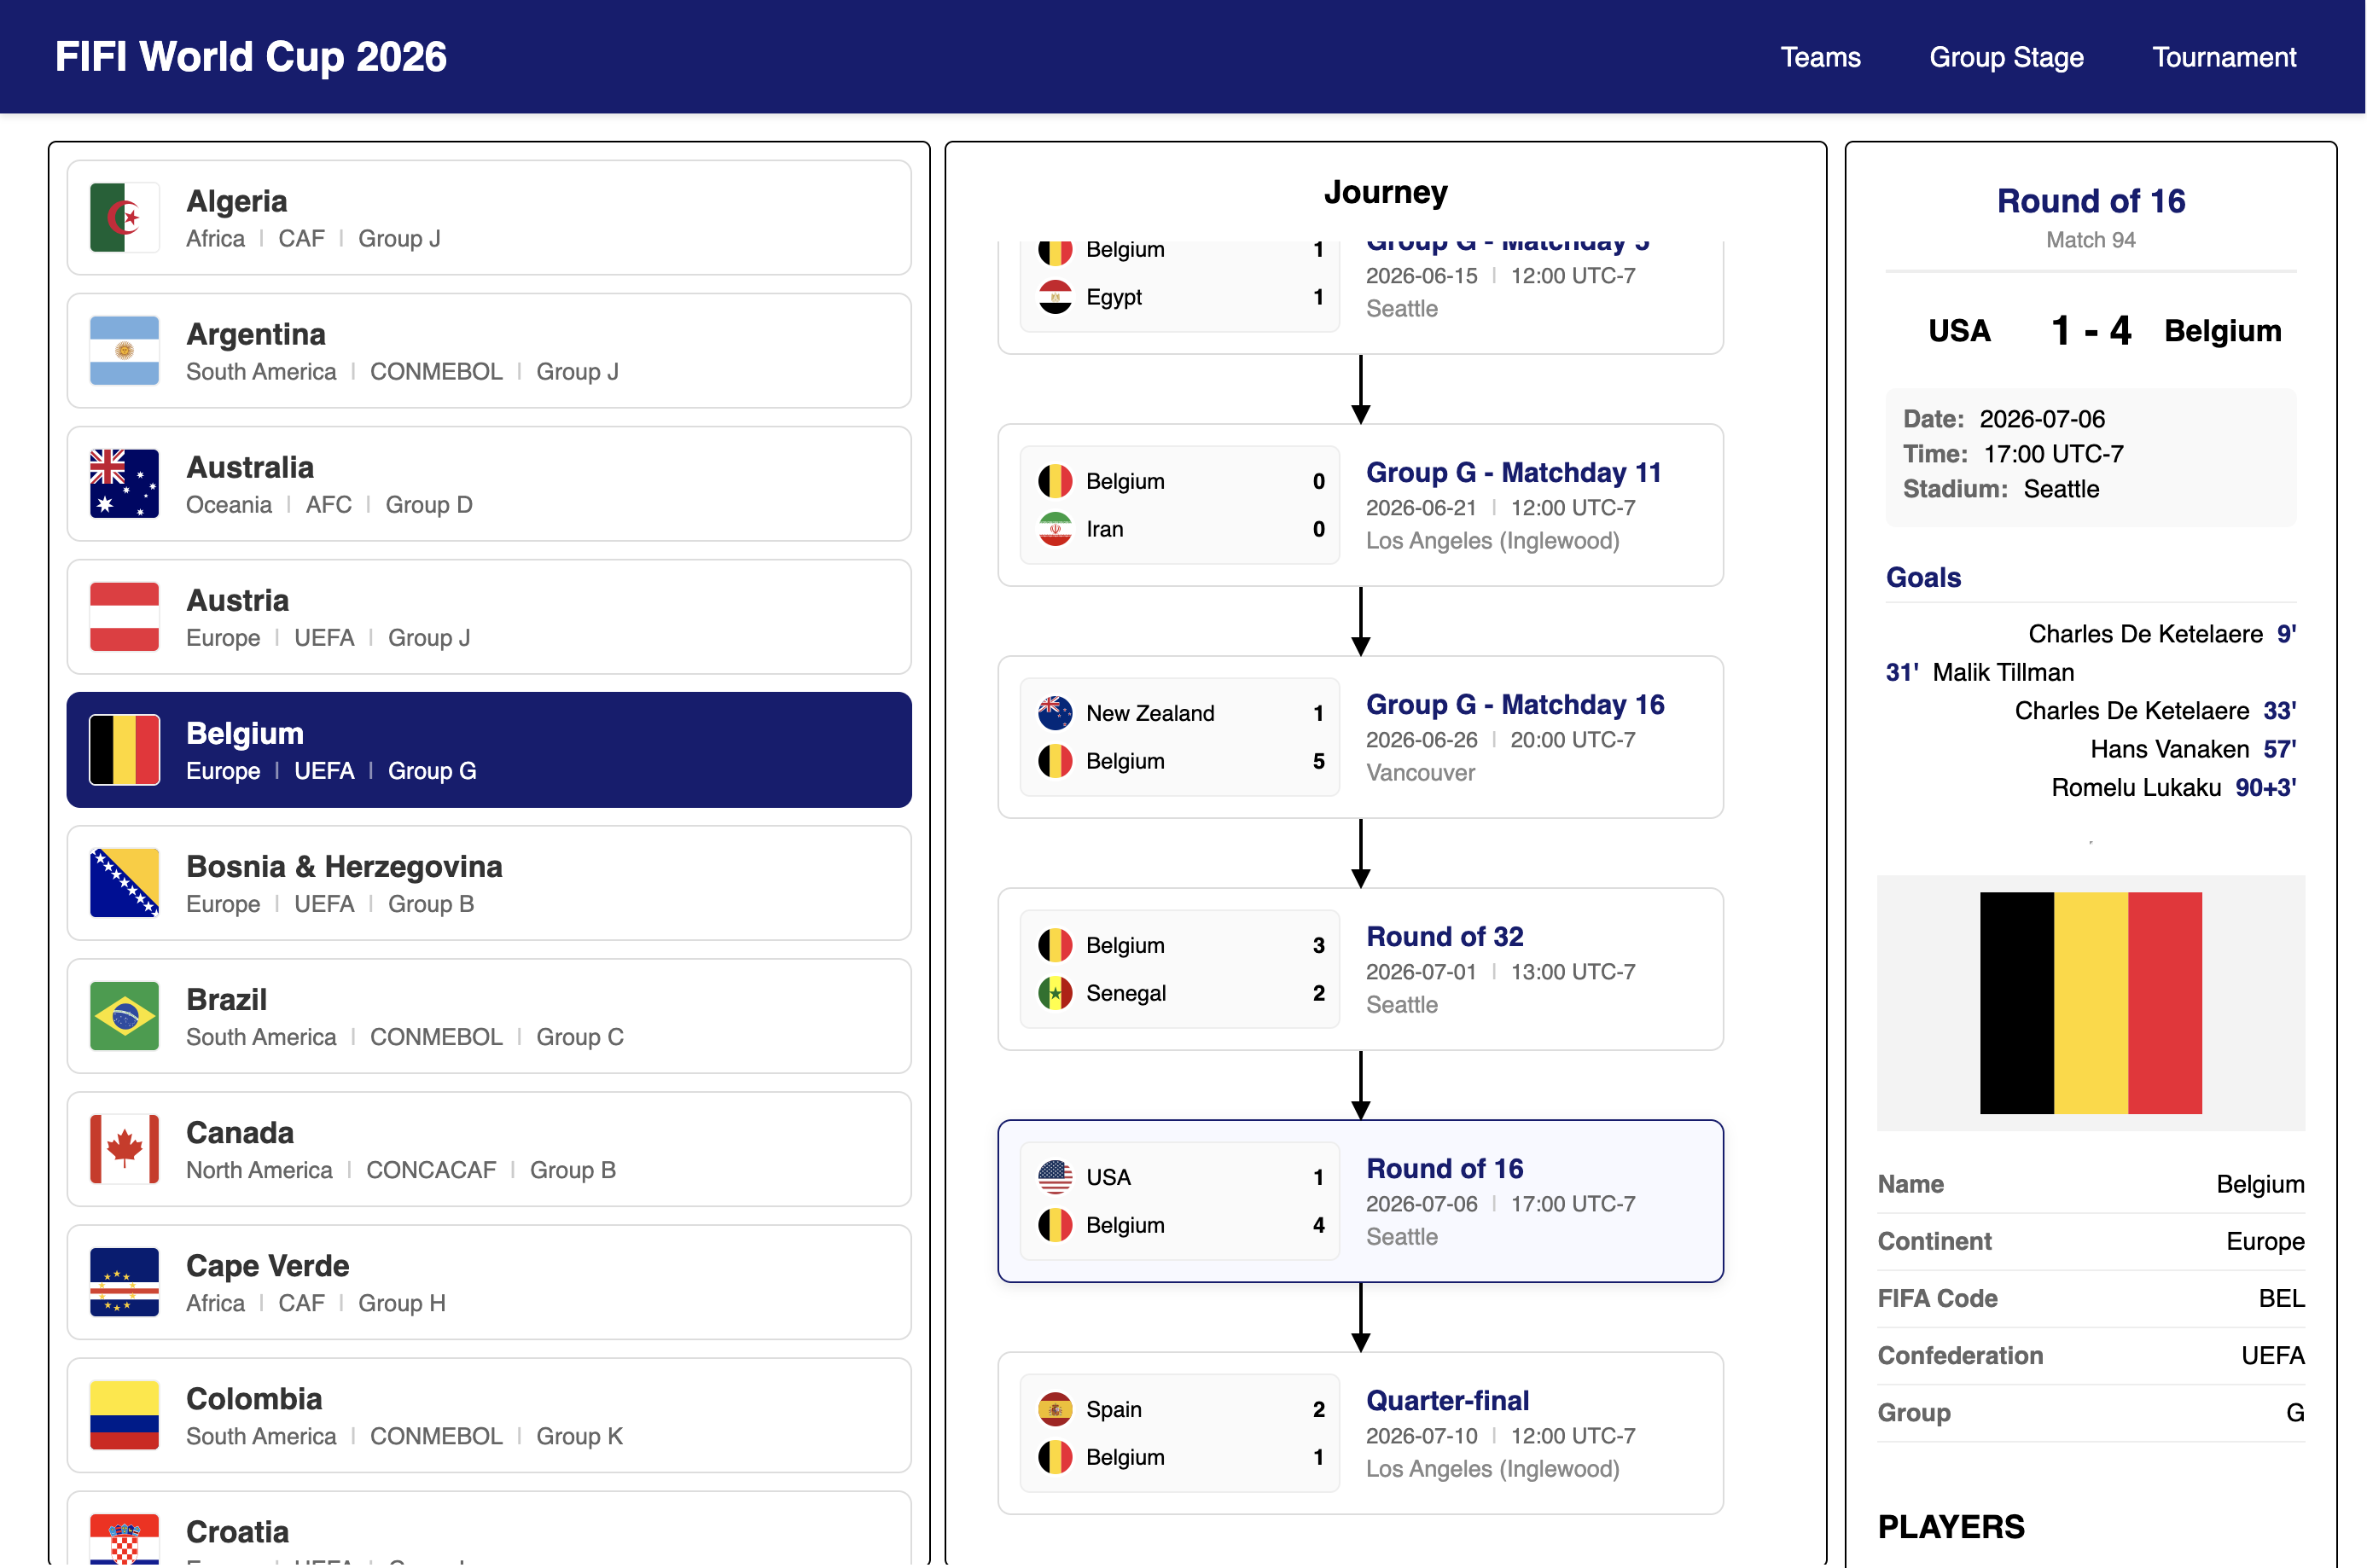
We released this for JsPlumb back in 2018 but we've always had a soft spot for some of the visualizations it contains, so we've updated it for VisuallyJs and added to our list of starter apps. It's a great showcase for the range of things you can easily build with VisuallyJs, containing several different views of the data, and integrating natively with React, Angular, Vue and Svelte.

The group stage view, with its high "data-ink" ratio, is one of our favourites:

We're also quite partial to the "journey view", which takes advantage of our new Paper component to render a static view:
Check out the demonstration here. There's a link to the repo if you want to clone it.
Changelog
General
- The
EVENT_GRAPH_CLEAREDevent, fired by the model, now passes the model that fired it as a payload. - The Surface was updated to fix an issue where it was holding on to stale viewport dimensions: calling
zoomToFitafter external change to viewport element size would use the cached dimensions. - Added the
data-vjs-no-eventsattribute which can be set on any element inside a node vertex, marking it as excluded from firing mouse events for that vertex. - Updated
centerOnandcenterOnAndZoomin the Surface to support optional centering on multiple elements as opposed to just a single one. - Added support for a
vjs-portattribute on controls inside an inspector. This allows you to edit properties on ports inside your vertices from the vertex inspector.
Breaking
- The previous
Indexclass was renamed toGraphSearchIndex - In
BaseAngularOverlayComponent, thesurfacemember was renamed toui; its type is now derived from a type parameter on the class (which you declare when you create a subclass)
React
- The
useZoomhook no longer requires that auican be passed in: it can derive one from the context. overlaysis now marked optional in theReactEdgeMappinginterface used in view options- Added
SurfacePopupcomponent, an automatic mechanism for launching a popup on a vertex component and keeping it located correctly as the user pans, zooms and drags the vertex. InspectorComponentupdated to function correctly inside aPaperProviderorPaperComponent
Vue
- Added
SurfacePopupcomponent, an automatic mechanism for launching a popup on a vertex component and keeping it located correctly as the user pans, zooms and drags the vertex. - Added support for Vue component overlays
Svelte
- Added
SurfacePopupcomponent, an automatic mechanism for launching a popup on a vertex component and keeping it located correctly as the user pans, zooms and drags the vertex. - Added support for Svelte component overlays
Angular
- Added
SurfacePopupcomponent, an automatic mechanism for launching a popup on a vertex component and keeping it located correctly as the user pans, zooms and drags the vertex. - Added several new signals to the
BaseVertexComponent-sourceEdges(),allSourceEdges(),targetEdges()andallTargetEdges(). With these signals you can dynamically respond to connectivity changes inside your templates. - Added
PaperComponent- a fixed view version of SurfaceComponent, with the same support for rendering but no pan/zoom, and which automatically adjusts its dimensions to fit into its viewport. The "data" and "url" inputs on theSurfaceComponent,PaperComponentandDiagramComponentof the Angular integration were updated to be reactive - you can hook them up to some state and have the component reload the dataset automatically.
Try VisuallyJs
VisuallyJs offers an extensive list of starter apps, diagrams, charts and dashboards to quick start your development, in React, Angular, Vue, Svelte and Typescript/Javascript.