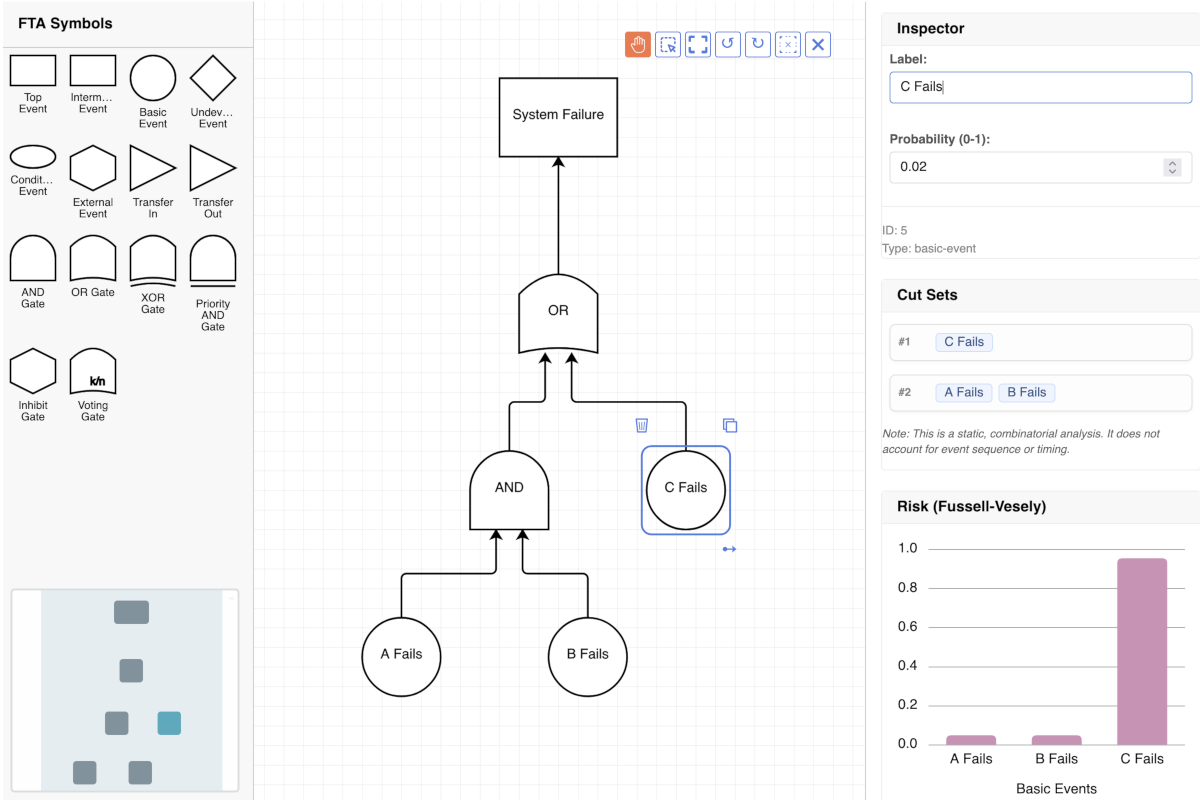
Combines a fault tree analysis diagram with charts showing risk and list of cut sets
Get the code
Grab the source code from Github and start working on your new app right now!
- React
- Angular
- Vue
- Svelte
npx degit [email protected]:visuallyjs-react/fault-tree-analysis fault-tree-analysis
npx degit [email protected]:visuallyjs-angular/fault-tree-analysis fault-tree-analysis
npx degit [email protected]:visuallyjs-vue/fault-tree-analysis fault-tree-analysis
npx degit [email protected]:visuallyjs-svelte/fault-tree-analysis fault-tree-analysis
What is Fault Tree Analysis and how can I develop a Fault Tree Analysis tool using VisuallyJs?
Fault Tree Analysis (FTA) is a top-down, deductive failure analysis in which an undesired state of a system is analyzed using Boolean logic to combine a series of lower-level events. It is widely used in safety engineering and reliability engineering to understand how systems can fail, to identify the best ways to reduce risk, and to determine event rates of a safety accident or a particular system level failure.
A key concept in FTA is the cut set, which is a set of events that, if they all occur, cause the top event to occur. A minimal cut set is a cut set that cannot be further reduced without losing its status as a cut set, representing the smallest combination of primary failures that can lead to the system failure.
VisuallyJs provides a robust framework for building interactive Fault Tree analysis dashboards in React, Angular, Vue and Svelte. With support for logical gates (AND, OR, XOR), specialized node types, and hierarchical layouts, you can create clear, navigable visualizations of complex failure modes and their relationships.
Angular Fault Tree Analysis
Building Angular Fault Tree Analysis diagrams is streamlined with VisuallyJs. Our leverages our specialized Angular components and services to provide a robust foundation for reliability modeling and risk assessment.
React Fault Tree Analysis
React Fault Tree Analysis implementations are highly efficient with VisuallyJs. The React Fault Tree Analysis starter app leverages React's functional components and our specialized providers to deliver a fast, responsive, and highly interactive tool for analyzing system failures.
Vue Fault Tree Analysis
Create interactive Vue Fault Tree Analysis diagrams easily with VisuallyJs. Our Vue Fault Tree Analysis starter app shows you how to integrate our diagramming plugins and components into your Vue application, providing a comprehensive solution for failure mode visualization.
Svelte Fault Tree Analysis
VisuallyJs offers excellent support for Svelte Fault Tree Analysis development. The Svelte Fault Tree Analysis starter app provides a streamlined approach using our Svelte-specific components and providers, helping you build fast and reactive FTA visualizations with minimal overhead.

Need some help?
We can build your app for you - in React, Angular, Svelte, Vue or Javascript/Typescript. Our team has 17 years of experience building visualisations and interactive UIs across a wide range of industries. Read more about what we can offer here, or click here to fill out a quick form detailing what you need, and we'll be in touch.
More apps
Chances are we've got something you can use to get you started. Don't see what you need? Contact us! We're always looking to expand our list of apps and feature demos.
Call Flow

Use VisuallyJs to build a visual Call Flow editor
AI Agent Builder

Use VisuallyJs to create an advanced AI agent builder
Chatbot

Use VisuallyJs to build a Chatbot editor, with actions, messages, input and choices
Flowchart

Fully featured flowchart builder including support for custom shapes, edge routing to avoid vertices, shape resize/rotate, SVG/PNG/JPG export and more
BPMN

BPMN editor for modelling the steps of a business process. Pools, lanes, and a full set of task, event and gateway types
ERD

ERD editor for modelling the steps of a business process
Gantt

Interactive Gantt chart featuring tasks, task groups and milestones
Kanban

Fully featured Kanban board. Drag items between columns and use the inspector to update items and columns
Database Schema

Database Schema builder with support for tables, views, multiple columns types, and column relationships
Org Chart

Uses the classic org chart layout and provides an inspector from which the user can navigate around
Circuit Diagram

Fully featured starter app containing a circuit diagram builder
Scada/HMI
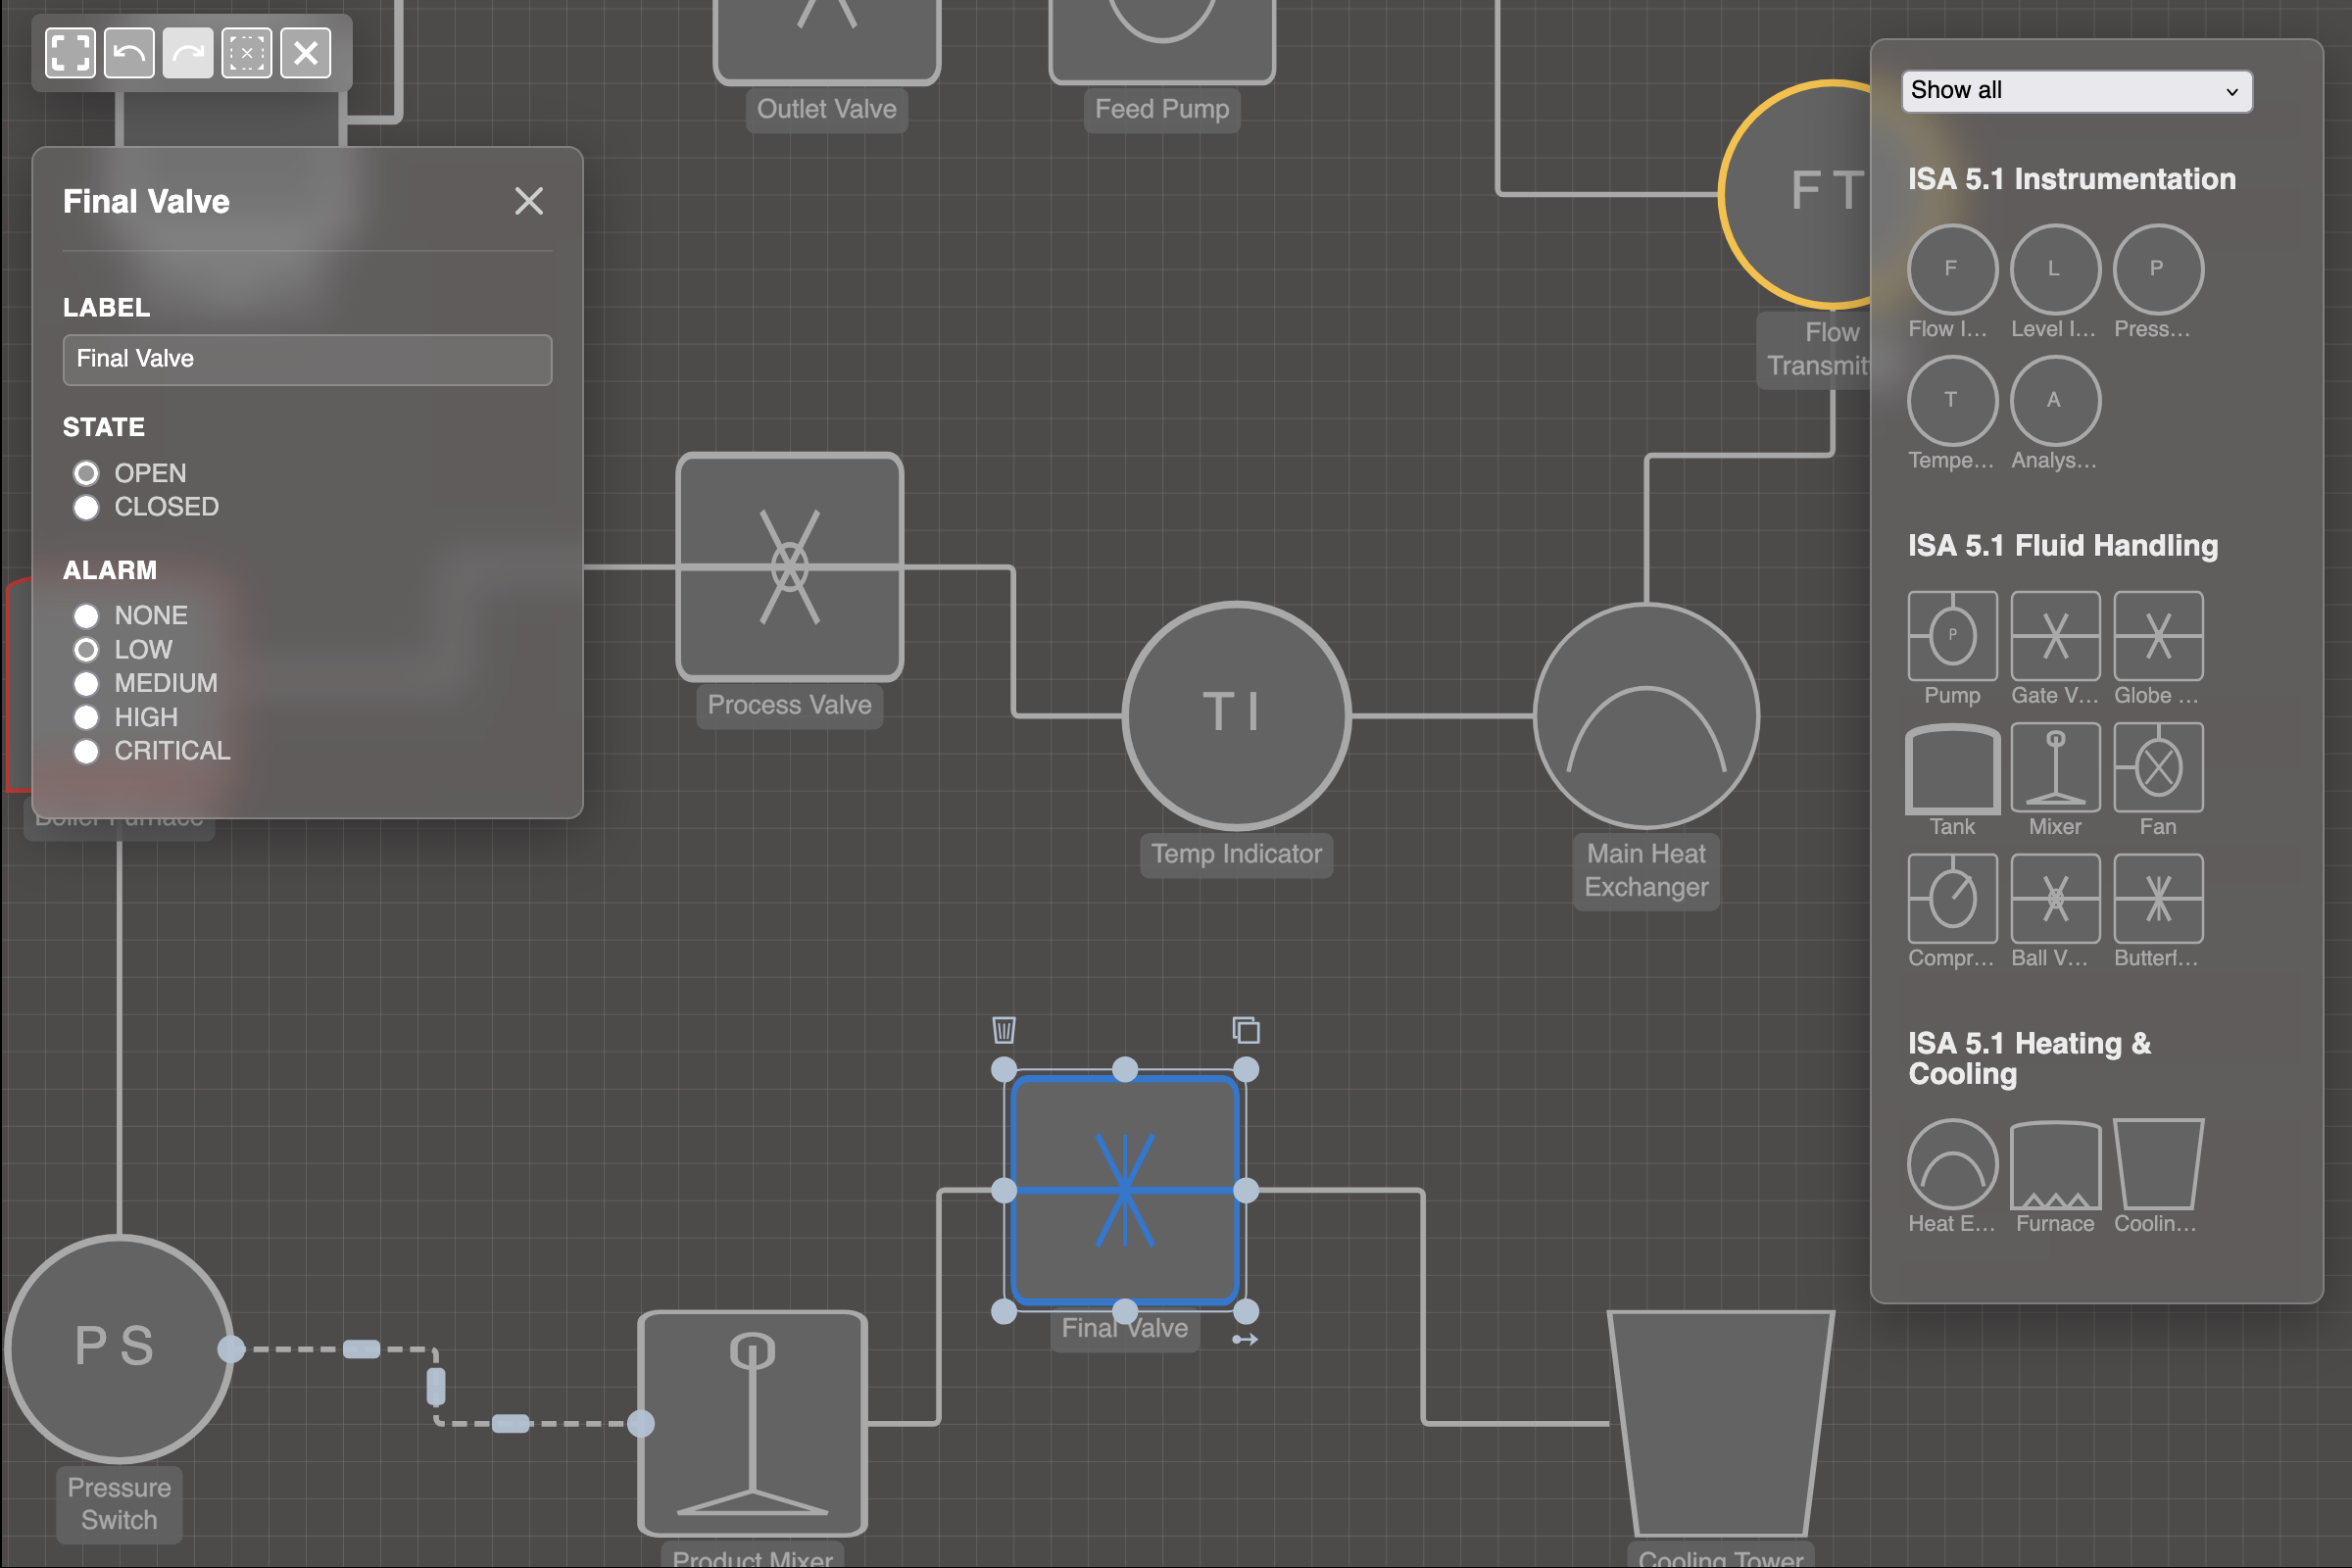
Professional and modern Scada/HMI application with fluid, heating/cooling & instrumentation shapes, adhering to the HMI ISA-101 Design Standard
Mindmap

The mindmap builder highlights several advanced features, such as custom layouts, parsers and exporters
Neighbourhood Views

Demonstrates how to include multiple views of a dataset on one page
Logic Gates

Fully featured starter app containing a logic gates diagram builder
Template

Basic starter app demonstrating how to setup VisuallyJs and its main features
Area & Line charts

Use VisuallyJs to create area and line charts
Bar & Column charts

Multiple series, stacked, grouped, pivoted, and much more
Scatter & Bubble charts

Circle, rectangle, triangle or custom markers, multiple series, fully customizable
Sankey chart

Use VisuallyJs to create a professional Sankey chart, with support for pivoting
Supply Chain Analyzer

Dashboard for managing and analyzing supply chains
Network Infrastructure

Combine a network management diagram with charts showing projected cost and resource usage
Scrolling Lists

Use the ListManager plugin to manage scrolling lists: as elements are scrolled out of the view, their edges are moved to the list container
FIFA World Cup

A visualizer for the FIFA World cup - group stages, team journeys and a tournament view.
Fault Tree Analysis

Combines a fault tree analysis diagram with charts showing risk and list of cut sets