Adding graph propagation to our logic gates app

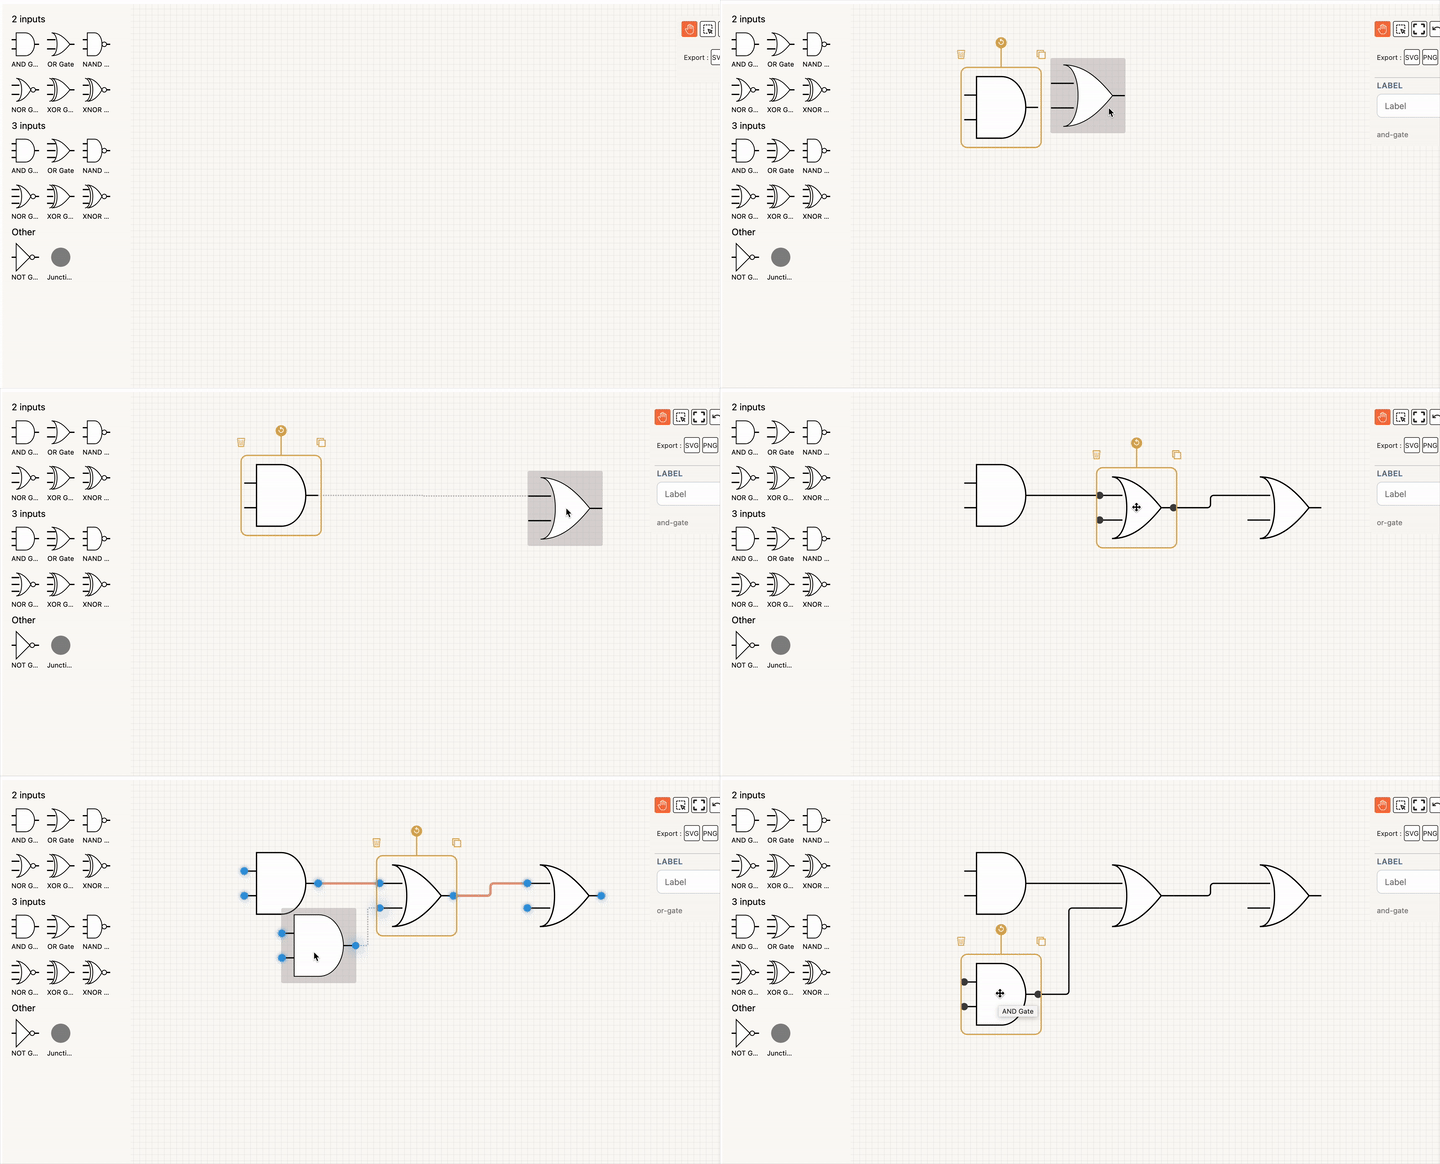
We shipped a Logic Gates diagram builder app for React, Angular, Vue and Svelte a few weeks ago. It's a cool app, allowing users to construct diagrams with some nifty features like auto edge connect while dragging, and auto connect when dropping on an existing edge:
what it didn't do, though, was offer the ability for someone to see the flow of logic through the diagrams they had created. And so that's the topic of today's article - we're going to run through how we went about adding a simulator function to this app.
Input/output shapes
The current set of shapes does not contain anything I can use to inject or read values. So I had a quick chat with an agent about it:
If you'd like, I can look at the code for your application and suggest how to add it.
In the context of a logic gates or circuit diagram application, the most common and fitting name for such a component is a Probe.
Here’s a breakdown...
...and this was the result, illustrating - hopefully - how agents find it easy to work with VisuallyJs:
A quick note on the instructions I gave it in my last message - data-vjs-source is the attribute used to markup elements as edge sources for interaction with the pointer, and data-vjs-target is the corresponding attribute for a target. data-vjs-anchor is a means for you to specify the anchor location and behaviour for an edge connected to the element
I then added this new shape set to my diagram:
import {IO_SHAPES} from "./io-shapes.ts";

const options:DiagramOptions = {
    shapes: [LOGIC_GATE_SHAPES(), IO_SHAPES],
    ...
}
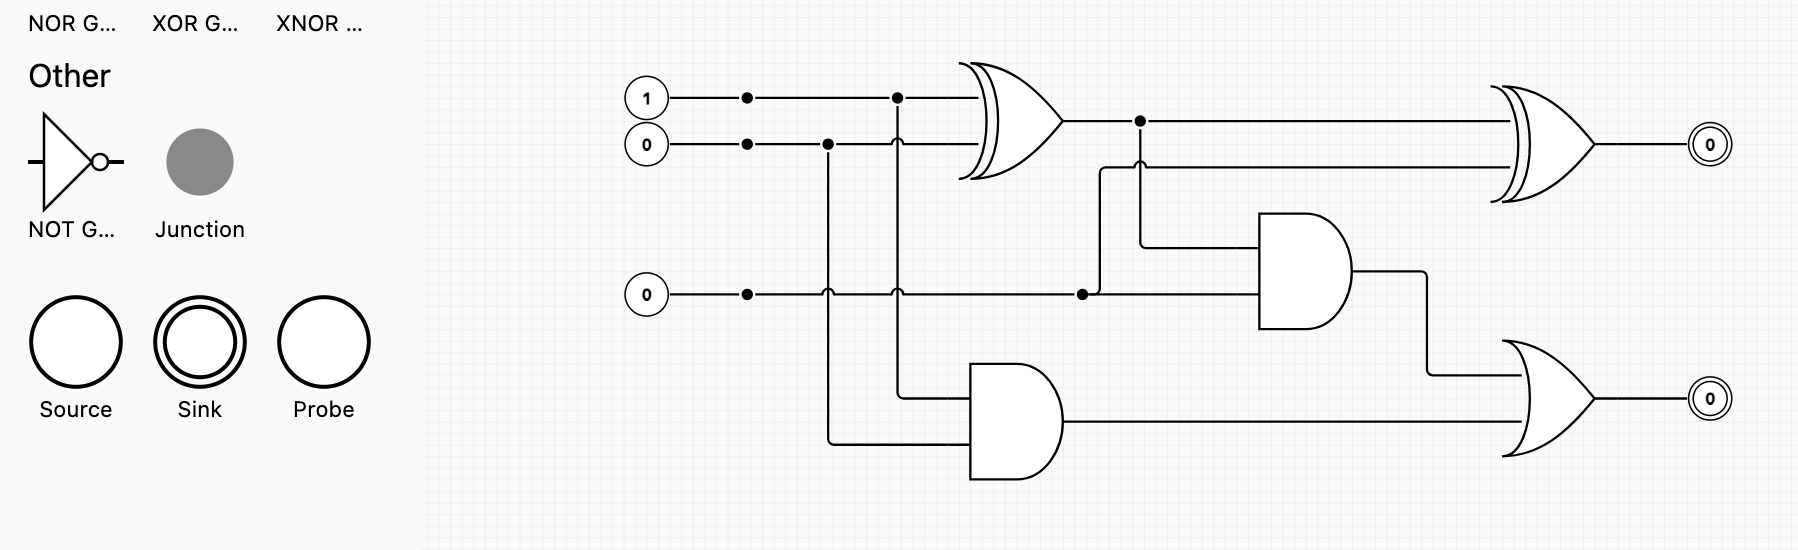
..and here it is in our palette. I've dragged a few on and connected them to the input and output pins:
Propagating values
The eagle-eyed among you may have noticed that the boolean circuit above is actually a Full Adder. In the setup shown, we have set pin A to 1 and pin B to 0. The output sum (the sink shown on the right at the top) should be showing a value of 1, but it's not - because we dont have a means of propagating values through the UI.
What we need is a graph propagation engine: we want to read values from upstream vertices, ask each node what its outputs should be, and then write those outputs onto the vertices connected downstream.
For the logic gates app, each node performs some boolean logic on its inputs, and makes that available as an output:
AND Gate
out = in1 & in2
OR Gate
out = in1 | in2
...etc. Those two examples only show two inputs, but our app allows an arbitrary number of pins per gate, so our propagation logic should support that.
Above, we added the concept of source, sink and probe node types to our UI. We then dragged a few of these onto our canvas, to arrive with this result - a full adder that has source value generators, and output value displays:
As we said before, we expect the top sink to be showing a 1. Since that sink is connected to the output of an XOR gate, what we mean here is "we want the output of the XOR gate to be computed to be 1". And in order to do compute the output of the XOR, we need to know the both the output of the previous XOR, and what the Carry In input's value is.
Each sink in a diagram requires the same set of operations: a recursive function that walks the graph, starting from the sink, and propagates values up the graph until it reaches a source node. How can we do this?
Node execution units
The trick is to treat each node as a single execution unit, which is responsible for computing two things:
- any internal state for the node
- a list of output values for the node
In our XOR example above, we don't have any internal state (or at least, I should say, in this app we don't really care to track internal state for XOR because we don't want to display it, but the XOR does implicitly carry the XOR of its two inputs as internal state), but we do have an output value we want to track. So in pseudo code, our XOR gate should return this:
function computeXOR() {
    const in1 = getInput("in1")
    const in2 = getInput("in2")
    const out = in1 !== in2         // you can fake an XOR this way with booleans
    return {
        state:{},
        outputs:{
            out
        }
    }
}
Conceptually that seems sound, but I appear to have hallucinated the getInput() function. What's needed there is some kind of context from which calculators can retrieve values:
function computeXOR(node, context) {
    const in1 = context.getInput(node, "in1")
    const in2 = context.getInput(node, "in2")
    const out = in1 !== in2         // you can fake an XOR this way with booleans
    return {
        state:{},
        outputs:{
            out
        }
    }
}
That's better: we pass in the current node and the context, and the calculator retrieves the inputs in1 and in2 from the context for the given node. We may as well just store the XOR node state now, since we have it:
function computeXOR(node, context) {
    const in1 = context.getInput(node, "in1")
    const in2 = context.getInput(node, "in2")
    const out = in1 !== in2         // you can fake an XOR this way with booleans
    return {
        state:{
            value:out
        },
        outputs:{
            out
        }
    }
}
The getInput method is now taking the focus node, and, in this case, a port ID, identifying the input. It should also support the second argument being null (or perhaps "default"), which would signal to retrieve the value for the node itself, not for a port on the node.
Each of our node types should have a corresponding execution unit, tailored for the specific boolean logic operation associated with the gate. We're going to call this execution unit a Calculator.
Coordinating node execution
Now that we have the concept of the individual node type calculators, we need something to coordinate their activity - the GraphPropagationEngine. It is responsible for orchestrating the execution of these calculators in a way that ensures the correct propagation of values throughout the graph.
A high level summary of its flow is as follows:
for each node in the dataset:
  for each edge with a target on that node:
    find the node that is the edge source and calculate its state+outputs
    retrieve the value from the appropriate output and set it on the target
That is quite high level, of course, but it does track the essential responsibilities. There are other considerations it needs to make when running:
- node calculation should only be executed once, and then cached
- values may be undefined
- loops must be avoided. If a loop is detected, the node calculation should exit.
GraphPropagationEngine
In VisuallyJs 1.2.8 we have added a GraphPropagationEngine class that functions according to the specifications set out above - you just need to plug in a set of calculators and VisuallyJs will take care of propagating values through the UI automatically.
You can use the graph propagation in both diagrams and apps.
Diagrams
Read a detailed description of the graph propagation engine for React Diagrams, Angular Diagrams, Vue Diagrams, Svelte Diagrams
Apps
Read a detailed description of the graph propagation engine for React Apps, Angular Diagrams, Vue Diagrams, Svelte Diagrams
Demonstration
This is the code in action - click on the source nodes on the left hand side to toggle their values, and you'll see the value in the output nodes change: